Growth Data
Measurable Student Achievement
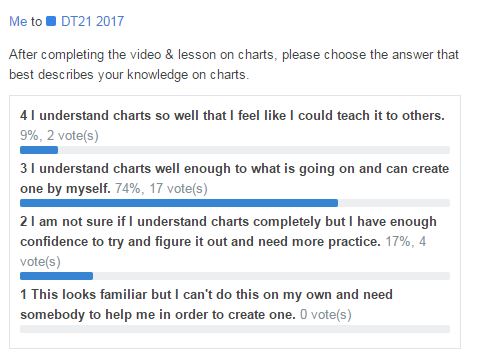
Marzano Rubric via Edmodo Polling
Our classes began giving feedback via Edmodo polling this year using a Marzano four point scale. This looks like the following image which is an actual poll taken in class after a lesson to allow students feedback on their own understanding:
METS Standards Growth
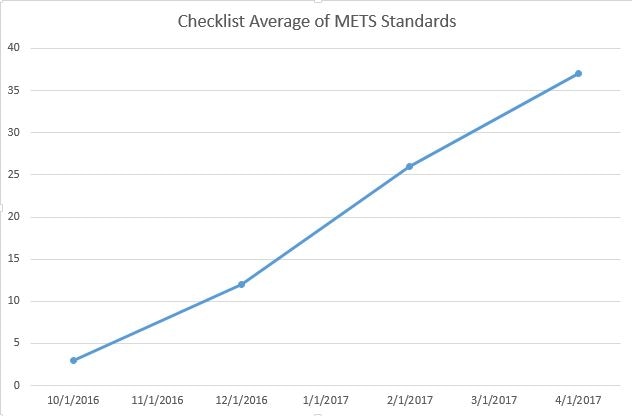
An average over time was taken of a checklist of the 9-12 METS Standards. Growth over mastery over the standards within the year is as shown in the following chart.
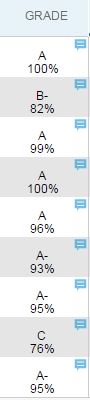
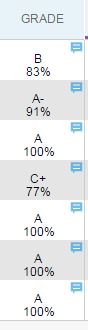
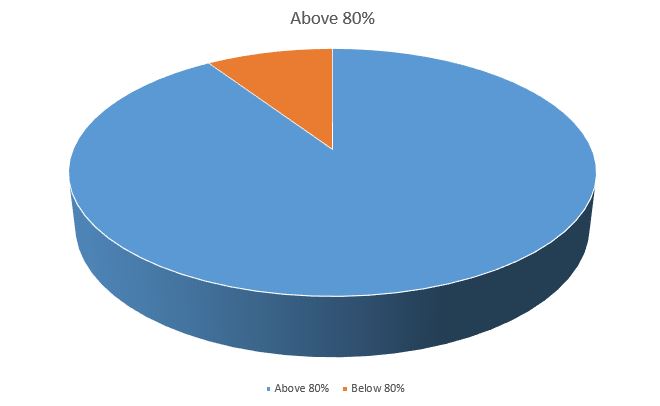
Above 80% Mastery of 80% of Students
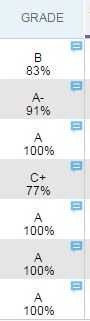
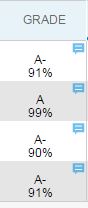
Over the course of the school year, a goal was set to be sure a minimum of 80% of students achieved at least 80% mastery. Although the grade snippets are only a small sample of all of Mrs. Leiker's classes (many are listed single since up to four subjects are listed per hour), they are typical of what you would find in class and the pie chart below shows a tally of ALL of Mrs. Leiker's students who have achieved mastery. A total of 91% of Mrs. Leiker's students are at or above an 80% in Quarter 3.
|
|
|
|
Self Evaluated Student Growth
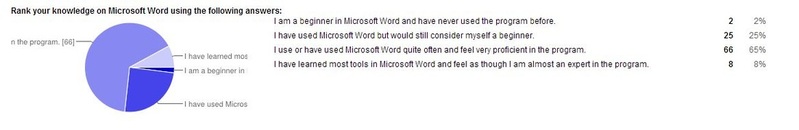
Microsoft Word growth was significant although most students feel like they have a grasp on Microsoft Word when they come in to the course. Students quickly see that they don't know how to use the tools as well as they should. No students felt like they were beginners in Word after the course and a full 59% of them felt like experts while before the course, 2% felt they were beginners and only 8% felt experts in the topic.
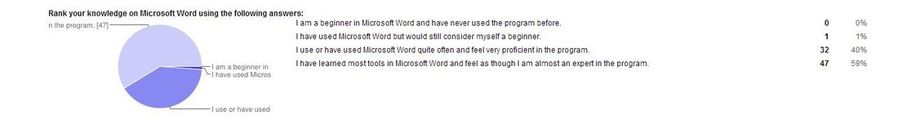 Google Survey Results After DT-21 Course
]
Google Survey Results Before DT-21 Course
Similar results were shown in both Microsoft Excel growth (see chart comparison below). Notice that 53% of students felt they were beginners in Microsoft Excel before taking DT-21 but 77% of them felt they were very proficient or experts after taking the course.
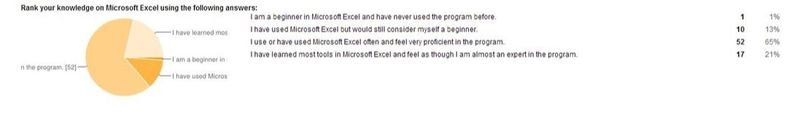
Google Survey Results After DT-21 Course
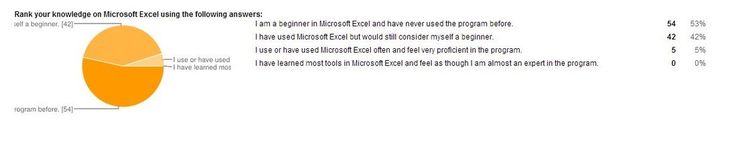
Google Survey Results Before DT-21 Course
In PowerPoint, notice that 64% of students considered themselves beginners in the program before taking DT-21. Nearly 100% felt very proficient or expert after the course:
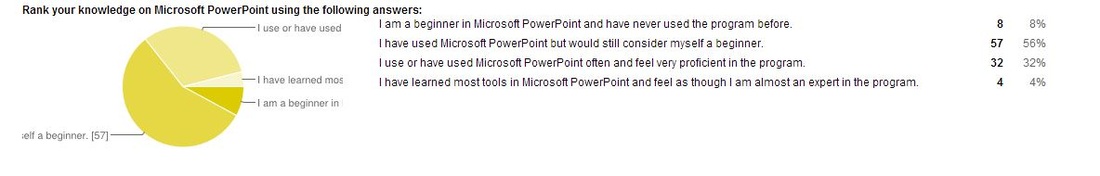
Google Survey Results Before DT-21 Course
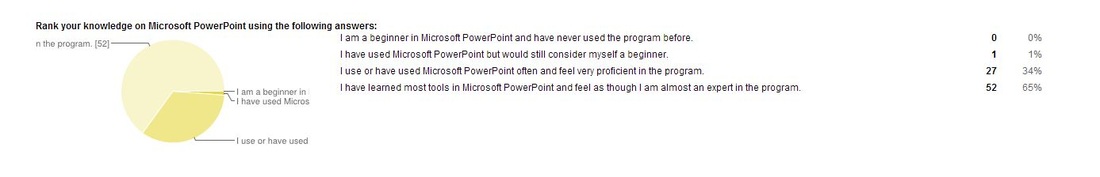
Google Survey Results After DT-21 Course
Students do not feel ready to take an online course when entering DT-21 (70% of them feel they could not complete a course without a teacher), but as you can see from the following charts, they feel they are much more prepared to do so after exiting this course (77% feel confident, comfortable and ready):
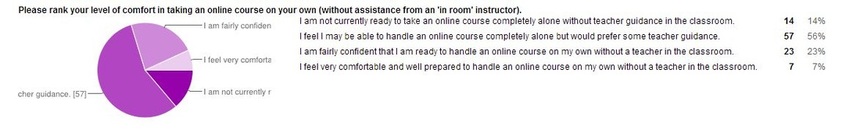
Google Survey Results Before DT-21 Course
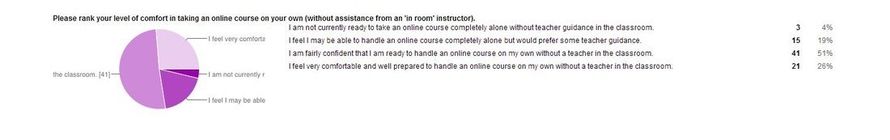
Google Survey Results After DT-21 Course
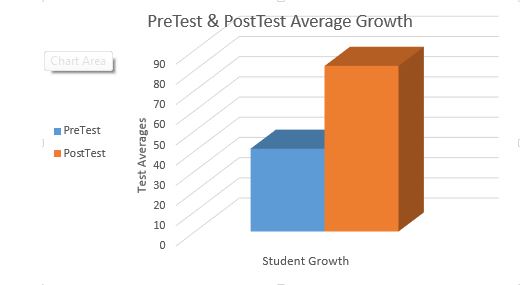
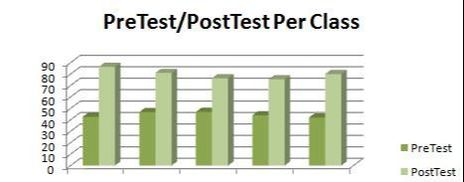
Pre/Post Exam Averages
Our classes took a PreTest and PostTest for semester material. The average percentages dramatically improved, as shown in this chart. As you can see, Mrs. Leiker's students improved an average of 42% in all classes. Every student improved by at least 33%. This information was obtained from Naiku.
|
|
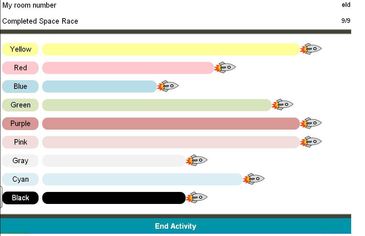
Socrative Exit Tickets & Statistics
Our class uses Socrative & Edmodo as a student response system to convey knowledge obtained and to submit questions on material. When student understanding isn't met, re-teaching of material is used. Individual issues sent via Exit Tickets in Socrative are also used to individualize needs for certain students (UDL).
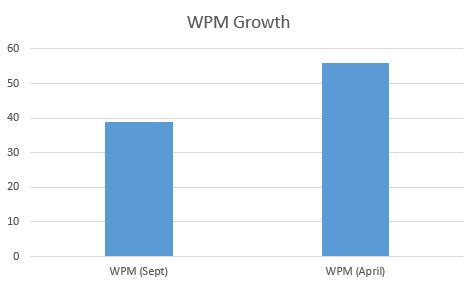
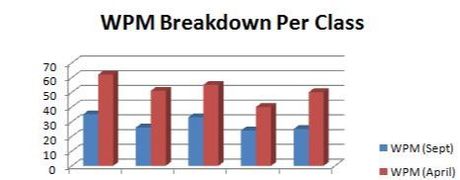
WPM Pre/Post Averages
Our classes went up an average of nearly 22 WPM (words per minute) over the course of the school year.
|
|
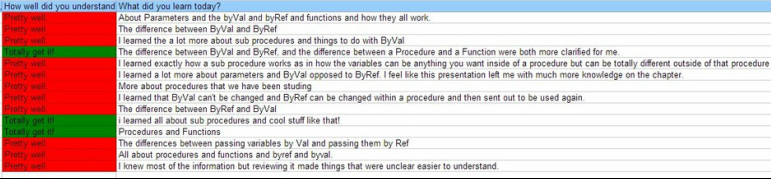
Time Capsule Papers
"The Word Review' Paper & "What I Have Learned" as well as "The Time Capsule" papers are used to allow students to freely write examples of student growth. These reactions are read and used to consider future curriculum guidelines. Included below are some samples of student writing clips.
|
Today I know much more about computers than I did on the first day of school. Now I know about different Microsoft programs, different parts of the computer, and different computer fields. Looking at this paper I realized how much I learned in this class. It says in my paper that I wasn’t surprised where computers were, but now I am. I thought I knew how common they were, but there are so many uses that I was unaware of. Reading this paper made me realize how important this class is. I learned how to do so many things that will help me in my high school career.
|
So much has changed over this year. I’ve learned so much more then what I knew before. I hadn’t even known what to look at in Excel and Access before, and even though I used Word all the time, I had no idea half of what it was capable of. I’ll use everything I’ve learned throughout life. I’ve already used many of the things I’ve learned on some of my finals papers.
|
I know a good deal more about computers than when I first entered this class. I thought I had even mastered PowerPoint, but I know even more about it now. I had no clue how to add video to it but it’s really simple! I feel like I am a better at typing than I have ever been before. This is the first time I have ever done anything for my class online, where you had to upload your work. This year I feel like I have done more things on my own also, instead of needing help ALL the time. I still would not be able to take computers apart, but I now know all about the history of computers.
|
Non Quantitative Data & #20Time
Although using numbers to represent growth can be a great thing, I find it also necessary for me to write about the non quantitative data that cannot be measured by simple numbers. With Project Based Learning (PBL) & #20 Time projects, students learn so much more than they do on a test. This year alone, some 7th grade students learned how to run their own production of a play for Kindergarten students complete with a crowd and social for parents and grandparents following, another student learned to play his guitar well enough to overcome the fear he has for performing for others and played in our school coffee shop, students are improving our school through proud displays on bulletin boards, outdoor seating areas for the lunchroom and cleaning and painting projects at the football field, in the weight room and in other areas in the school. One student is working to get playground equipment for the special needs students in the ISD and another is raising money to bring fun to hospital ridden children. I believe students use so many skills and have to persevere in ways far beyond what a test can measure. Although there is no way for me to 'measure' this growth for you, I feel the need to write this to let the world know that growth can be SEEN too with the human eye and heart. And I am proud to say that I SEE growth every day in my students. If I didn't, I would choose another job.
